GexVision.
Real dealer gamma exposure, computed from the full options chain, drawn as tradable levels on your chart.
IntroductionWhat this tool is for
GexVision reads the full options chain of a symbol —every strike, every expiration, with its open interest, its implied volatility and its greeks— and computes where dealer gamma exposure is concentrated. Those prices are what you see drawn on your chart.
They are not technical-analysis lines or moving averages. They are prices where an enormous amount of capital is forced by its own hedge to buy or to sell. That is why price reacts there so often: it is not magic, it is hedging mechanics.
This page covers three things, in order: (1) what dealer gamma exposure is and why it moves price, (2) what exactly each level of the indicator means and how it is traded, and (3) how to install it and keep it updated on TradingView and Bookmap. If you have never used options data, read it in order. If you already know GEX, skip straight to the levels.
GexVision does not predict direction. It describes how price tends to behave around certain levels: whether it tends to reverse or to accelerate, whether the day tends to be range-bound or trending, and where a move is more likely to stall. Direction and entry are yours, from your own process.
01 · FundamentalsWhat GEX is and why it moves price
When you buy an option, somebody has to sell it to you. That somebody is almost always a market maker —a dealer—. The dealer does not want to bet on market direction: it wants to earn the spread and stay neutral. To stay neutral it has to hedge by buying or selling the underlying. That hedge is the flow that moves price.
Delta: how much underlying the dealer needs
An option's delta tells you how much the option moves for every dollar the underlying moves. If a dealer sells you a call with 0.40 delta, it is short 40 deltas and buys the equivalent of 40 shares (or the matching futures exposure) to flatten out.
Gamma: how much it has to RE-hedge when price moves
The problem is that delta is not fixed. Gamma measures how much delta changes when price moves. It is the speed of the hedge. If gamma is high, a small move in the underlying forces the dealer to buy or sell much more to stay neutral. If gamma is low, it barely has to do anything.
Dealer gamma exposure (GEX) aggregates all of that gamma in dollars, strike by strike, across the entire options market of that symbol:
GEX per strike = Gamma x Open Interest x 100 x Price² x 0.01The result reads as dollars of underlying that dealers have to trade for every 1 % move in that symbol. Under the standard market assumption —dealers long calls and short puts— calls add positive gamma and puts subtract negative gamma. Summing every strike gives you Net GEX, and the strike-by-strike profile is what produces every level you will see on the chart.
A GEX level matters because at that price there is a lot of money whose behavior is predetermined by hedging, not by an opinion. The more gamma there is at a strike, the stronger that mechanic.
02 · FundamentalsThe two gamma regimes
Everything you read in GexVision comes down to knowing which of these two worlds you are in. It is the difference between a day where you fade the extremes and a day where fading the extremes runs you over.
Positive gamma — dealers dampen the move
Dealers are long gamma. When price rises, their delta grows and they have to sell underlying to get back to neutral. When price falls, they have to buy. In other words: they buy the dips and sell the rips. Their hedge always runs against the move.
Result: price gets anchored. Tight range, mean reversion, compressed volatility, small candles, extremes that get rejected, breakouts that fail. Moves exhaust themselves because there is a mechanical seller above and a mechanical buyer below.
Negative gamma — dealers accelerate the move
Dealers are short gamma. Now the opposite happens: when price rises they have to buy more, and when it falls they have to sell more. Their hedge runs with the move and amplifies it.
Result: price accelerates. Trend, momentum, ranges that widen, selloffs that extend further than seems reasonable, moves that do not pull back. This is where volatility-expansion days are born.
The same approach that works in positive gamma breaks down in negative gamma, and the other way around. Before looking for an entry, always check where price sits relative to Zero Gamma and what sign Net GEX has. That is the first filter of the day.
03 · The levelsWhat each line on the chart is
Level by level from here on: what it is, what it means when price approaches it, and how it is used. The indicator colors are consistent across the whole product: blue for calls and positive gamma, red for puts and negative gamma, amber for Zero Gamma and violet for Max Gamma.
Zero Gamma · HVL · gamma flip
The price at which net dealer gamma crosses zero. Above that line, dealers as a whole are long gamma; below it, short. GexVision finds it by recomputing the full gamma profile over a grid of prices, not by interpolating between two strikes, so it moves whenever implied volatility or time to expiration changes.
It is a regime switch, not a support level. With price above it: mean reversion, extremes that fade, tight ranges. With price below it: trend, momentum, wide ranges and moves that extend. Crosses often coincide with a visible change in candle size.
It is the first line to look at each day, before any other. It frames what kind of day you are trading and therefore which approach makes sense: fade above, momentum below.
A cross with acceptance —not just a wick— is your cue to switch modes. If you were fading the extremes and price loses Zero Gamma, stop doing it.
The indicator can also show Zero Gamma 0DTE (computed only from today's expirations, more relevant intraday) and Zero Gamma ex-0DTE (excluding them, more structural). Both are toggles in the settings.
If you could keep only one level on the chart, keep this one. Everything else is read in terms of which side of Zero Gamma price is on.
Call Wall
The strike with the largest call gamma above the current price. It is where the biggest block of call positioning that dealers have to hedge is concentrated.
It acts as a ceiling and a magnet at the same time. As price approaches, dealer hedging forces them to sell more underlying, and rallies run out of fuel. Historically, many sessions close just below this level without ever clearing it.
As a natural profit-taking target for long positions: it is where the move tends to run out of steam.
As a poor area to chase longs into: buying just below the Call Wall means buying exactly where a mechanical seller sits.
If it breaks on volume and price accepts above it (not a wick, but bars that hold), the sign of the hedge flips and it can trigger a squeeze: dealers go from selling to buying, and price often accelerates toward the next level above.
Put Wall
The strike with the largest put gamma below the current price. It is where the largest amount of protection bought by the market piles up.
It acts as a floor. When the market falls toward that price in a positive gamma regime, dealer hedging has them buying underlying, and the selling slows down. It is the level where selloffs stall most often.
As a target for short positions, and as an area to look for an upside reversion if the rest of the context supports it.
As a risk reference: while price stays above it, the structure is still supported.
Watch for the opposite: if price loses the Put Wall while already in negative gamma, the effect inverts and the move often accelerates, because that protection translates into futures selling. That is one of the most common fast-selloff scenarios.
Max Gamma
The strike with the largest net gamma in absolute value, whether it comes from calls or from puts. It is the point of maximum hedging concentration in the entire profile.
It is the strongest magnet on the chart: the pin. Price tends to be drawn toward it and to orbit it. The effect grows as expiration approaches, because gamma concentrates: it shows up far more on a Friday afternoon, or in the last hour of a session with 0DTE, than on a Monday morning.
If price is above Zero Gamma and close to Max Gamma, expect compression: a tight range around that strike, small targets and little follow-through on breakouts.
It is the natural destination shown by the Directional bias row when the regime is positive gamma (pull to).
If price is far from Max Gamma and in positive gamma, that strike is a reasonable target for the session.
GEX 1 to GEX 10 · the gamma ladder
The ranking of the strikes with the most gamma in dollars, sorted from largest to smallest. GEX 1 is the strongest, GEX 2 the next one, and so on down to GEX 10. In the settings you can choose how many to draw (from 1 to 10); by default the first 5 are shown. The top three are drawn with a thicker line.
Blue = positive gamma at that strike. Dealers absorb: they buy below and sell above. The level tends to HOLD.
Red = negative gamma at that strike. Dealers push in the direction of the move. The level tends to BREAK and accelerate.
Think of it as a heat map of prices. At the blue levels look for reactions, fades and mean-reversion entries, with your stop on the other side. At the red levels do not defend the position: if price loses them, continuation is the norm, not a bounce.
A dense cluster of blue levels above and below price is the signature of a range day. A run of red levels below is a clear path lower.
The distance between GEX 1 and price tells you how much room there is before the next reaction you can reasonably expect.
Hold / Break labels and their intensity
A label attached to the GEX levels and the walls, with two parts:
- Hold — net gamma at that strike is positive: dealer hedging works against the move and tends to defend the level.
- Break — net gamma is negative: hedging works with the move and tends to push through and accelerate.
- HIGH / MED / LOW — the relative size of that gamma compared with the largest level of the day. HIGH is a large concentration; LOW is residual.
HIGH means there is a lot of capital obligated to behave that way at that price, so that behavior is more likely. LOW means the concentration is small and the level may go unnoticed.
As a quality filter for the levels, not as a signal. Prioritize trading reactions at Hold HIGH levels and continuations through Break HIGH levels. Do not build a trade whose only rationale is a LOW level.
You can turn these labels off in the settings if you prefer a cleaner chart.
These labels are positioning tendencies, not predictions and not guarantees. They are not win rates and they are not signals. They measure where the money that is obligated to hedge sits, nothing more. A macro catalyst —CPI, FOMC, a headline, an auction— can go straight through any level, however HIGH it is, with no warning. Use them as context and always manage risk as if the level could fail.
Directional bias · dashboard row
A row of the summary panel that turns the current regime into a one-line read: where price tends to go according to positioning, and with what confidence.
In positive gamma it reads pull to <Max Gamma>: price is being drawn toward the pin. That is a compression read, not a trend read.
In negative gamma it reads accel to <Call Wall> or accel to <Put Wall>: price tends to move away from the flip and to accelerate toward the wall on whichever side it is.
The HIGH / MED / LOW confidence is computed by comparing the distance to that target with the expected move of the session. If the target falls inside the move the options market is pricing today, confidence is high; if it is much further away, it is low, because under normal conditions there is not enough time to get there.
As session context, never as an entry. If your idea lines up with the bias, you have the wind at your back. If you are going against it, demand more confirmation, size down or wait for a better price.
Net GEX · total gamma in dollars
The sum of all the gamma of the symbol, expressed in dollars per 1 % move in the underlying. It is the size of the hedge dealers would have to execute if price moved one percent.
Large and positive — a calm, range-bound day with suppressed volatility. Moves exhaust and revert.
Negative — a volatile day, trending, with wide ranges. Moves extend.
What matters is not the absolute number but whether it is high or low for that symbol. Get in the habit of comparing today's value with that of the previous days.
For sizing and choosing targets. With Net GEX strongly positive: small targets, fades at the extremes, do not chase breakouts. With Net GEX negative: give the trade room to run, use wider stops and size down, because the session range widens.
Net DEX · dealer delta
Net dealer delta exposure: how much accumulated directional position they have to offset, aggregating the whole options chain.
Markedly positive DEX → dealers are carrying long delta and tend toward selling rallies: they sell into strength to get back to neutral. That is a headwind for upside extension.
Negative DEX → dealers are short delta and tend toward chasing price: they chase it by buying. That feeds continuation in the moves.
As a flow nuance layered on top of the gamma read. If Net GEX and Net DEX point the same way, the read is cleaner. If they contradict each other, lower your conviction.
Expected move · ATM straddle
The price of the at-the-money straddle of the nearest expiration: literally, the move the options market is charging for this session. It is drawn as a band above and below the reference price.
It is the range the market itself treats as normal for today. It is not a hard boundary —it gets exceeded often— but it is a consistent and honest yardstick, because it comes from a real price somebody is paying.
Targets. A target inside the expected move is reasonable; one that requires two times the expected move needs a catalyst.
Feasibility test for a level. If the Call Wall is 2.5 expected moves away, it is not a realistic target today: use it as structural reference, not as a target.
Exhaustion. Once price has already covered the full expected move of the day, the odds of clean continuation drop: it is a better area to take profits than to initiate.
0DTE walls · same-day expiration
The same walls —Call Wall, Put Wall and Zero Gamma— but computed only from the contracts that expire today. In the indicator they show up as CW 0DTE, PW 0DTE and ZG 0DTE, drawn with a dashed line.
In SPX and NDX (and in SPY/QQQ) the daily-expiration contracts carry most of the volume, so they dominate intraday behavior. When the 0DTE walls do not line up with the all-expirations ones, the 0DTE walls are what govern trading the session.
These levels decay through the day: as the close approaches, gamma from the contracts expiring today spikes near price and dies off away from it. That is why the pin effect is much stronger in the afternoon than in the morning.
For intraday, use the 0DTE levels as your working levels and the all-expirations ones as background structure.
The indicator also includes volume-based 0DTE walls (a toggle in the settings), computed from the volume traded today instead of yesterday's open interest. They approximate the positioning being built in the current session.
Gamma support / resistance and OI walls
Gamma support is the nearest positive-gamma strike below price, and gamma resistance the nearest one above. They are intermediate reaction levels, useful when price is far from the main walls and you need finer references inside the range.
The strikes with the highest raw open interest, not weighted by gamma. They tell you where the most contracts are open, which is not exactly the same as where the most hedging sits. They are a secondary reference: less precise than the gamma levels, but very visible to the rest of the market. They are off by default.
04 · TradingHow it all reads together
Levels on their own are worth little. The value is in the combination: regime, distance and relative size. This is the order in which it pays to read the dashboard.
60-second checklist, before you trade
- Where is price relative to Zero Gamma? Above: fade mode. Below: momentum mode.
- What sign and what size is Net GEX? It frames whether the day is range-bound or expansionary.
- Where are the Call Wall and the Put Wall, and how much room is there to each one?
- Where is Max Gamma? If price is already on it, expect compression.
- What is the expected move, and how much of it is already used up?
- What does Directional bias say, and with what confidence?
- The nearby levels: are they Hold or Break, and at what intensity?
Desk scenarios
Price above Zero Gamma, close to the Call Wall, Net GEX strongly positive. Expect chop and fade. Longs chasing into the Call Wall carry poor risk/reward: you are buying exactly where a mechanical seller sits. If you trade it, look for tactical shorts toward Max Gamma or the first blue GEX level, with small targets.
Price below Zero Gamma, Net GEX negative. Put the mean-reversion mindset away: fades get run over here. Look for continuation toward the Put Wall. Wide ranges: wider stops and smaller size so that your dollar risk does not change.
Price trapped between a blue GEX 1 below and the Call Wall above, with Net GEX positive. Range day: trade the edges and not the middle. Every approach to an extreme is an opportunity; every bar in the center is noise.
Price breaks Zero Gamma to the downside with acceptance. This is the moment to switch modes, not to defend the previous idea. The targets become the Put Wall and the first red level. If you had fade positions on, review them: the environment that justified them no longer exists.
| Situation on the dashboard | What it usually means | What to watch |
|---|---|---|
| Price above Zero Gamma · Net GEX strongly positive | Range Compressed volatility, extremes that get rejected. | That price does not lose Zero Gamma. If it does, the scenario inverts. |
| Price below Zero Gamma · Net GEX negative | Trend Moves that extend and do not pull back. | Distance to the Put Wall and how much expected move is left to travel. |
| Price glued to the Call Wall | Ceiling Rallies stall on dealer hedging. | Acceptance above it on volume: it can turn into a squeeze. |
| Price glued to the Put Wall in positive gamma | Floor The area where selloffs tend to stop. | Losing the level while already in negative gamma: it tends to accelerate. |
| Price near Max Gamma, near the close | Pin Compression toward the strike, especially with 0DTE. | Breakouts that fail. Small targets. |
| Next level labeled Hold HIGH | Reaction more likely Large concentration of positive gamma. | Good area to look for a reversion; bad area to chase. |
| Next level labeled Break HIGH | Acceleration more likely Concentrated negative gamma. | Do not defend the level. Think continuation. |
| Expected move already used up | Exhaustion The day has already done what the market was charging for. | Better area to take profits than to initiate. |
| Directional bias reading accel to with HIGH confidence | Momentum The target is within the day's reach. | Trading against that bias demands more confirmation. |
| 0DTE walls far from the all-expirations walls | Conflict The intraday and the structural picture do not agree. | For the session 0DTE governs; for swing, the all-expirations walls. |
GexVision tells you where and under what conditions. The entry, the trigger and the management are still yours: order flow, structure, your usual setup. What changes is that you stop trading arbitrary levels and start trading levels where there is a mechanical reason for something to happen.
05 · The terminalThe options chain, contract by contract
The levels are the summary. The options chain is the material they are made of: every contract trading on the symbol, with its price and its greeks. Open it in the terminal, under Options chain.
It reads like a professional screen: calls on the left, puts on the right, and the strike down the middle. A highlighted row marks where price is right now, so everything above that line sits above the market and everything below it, below. The buttons on top pick the expiration.
What each column is
| Column | What it is and how to read it |
|---|---|
| Bid / Ask | Best bid and best offer. The distance between them is what getting in and out costs you: if it is wide, that contract barely trades. |
| IV | Implied volatility: how much movement the market is pricing into that contract. It rises with fear and ahead of events. |
| Δ delta | How much the option moves for every point the underlying moves. A 0.50 moves half. It also reads, carefully, as the rough probability of finishing in the money. |
| Γ gamma | How fast delta itself changes. This is the column that explains the levels: where gamma piles up, dealers must hedge more — and that is where price stalls or accelerates. |
| Θ theta | What the contract loses in value every day purely because time passes. Always against the buyer and in favor of the seller. The closer to expiration, the faster it melts: that is why a 0DTE carries an enormous theta compared with a monthly. |
| V vega | What the contract gains for every point implied volatility rises. It tells you how much of what you paid is a bet on volatility rather than on direction. |
| OI | Open interest: contracts alive at that strike. This is position accumulated on previous days. |
| Vol | Volume traded today. Against OI it tells you whether the strike is being used today or is old positioning. |
| GEX | That contract's gamma translated into dollars dealers must hedge per 1% move, with the dealer sign. Blue adds, red subtracts. Summed by strike, this is the number that draws the Call Wall and the Put Wall. |
Top right there is a Greeks · Basic / All switch. "Basic" hides theta and vega to keep the screen clean when you only want price, delta and gamma; "All" shows them. On phones it starts on Basic on purpose. Your choice is remembered.
Both are "decay as time passes", but of different things. Theta is what the option's price loses: it matters to whoever is holding it. Charm is what the delta changes by: it matters to the dealer, because it forces him to buy back or release hedges as the day goes on. The one that moves the market into the close is charm — and it has its own panel.
06 · The terminalThe chain as it stood: history
The live chain tells you how the board looks now. Often the useful question is a different one: how did it look before that happened? That is what the ⟲ History button inside the chain is for.
Press it and a picker appears with the stored moments. Choose one and the whole table becomes the snapshot of that instant: the same contracts, with the prices, greeks, open interest and volume they had then. A purple band warns you that you are looking at the archive and not at the market, and the Live button brings you back to the present.
How it actually gets used
- Before and after a move. Open the chain half an hour before the break and compare it with after: you will see where the volume appeared and which strike loaded up.
- Checking a wall. If price stalled at the Call Wall, look at that hour in the archive: did open interest at that strike grow during the session, or was it already there at the open?
- Reviewing your own trade. Go back to the minute you entered and see what the market was pricing then, instead of reconstructing it from memory.
It is archived for SPX, NDX, SPY and QQQ, one snapshot every 15 minutes, kept for 30 days. If you ask for an exact time you get the most recent snapshot at or before that moment — the same thing you would have seen looking at the screen then — and the response tells you which minute it actually is. Archiving started on September 10, 2026: before that date there is nothing to show, because nothing was being stored.
GET /api/gex/{symbol}/chain/times lists which instants exist, without downloading any. GET /api/gex/{symbol}/chain/history?at=2026-09-10T14:30:00Z returns the chain from that moment. It is all in the API reference.
07 · The terminalVanna and charm: the two forces you don't see
Gamma explains why price stalls at a wall. Vanna and charm explain why the board moves on its own even when price does nothing.
How much the dealer's delta changes when volatility changes. When the VIX falls, dealer hedges drift out of line and they have to buy the underlying without anybody having bought anything: that is the engine behind those days that grind higher in silence. The Vanna Wall is the strike where that exposure concentrates.
How much the dealer's delta changes purely because time passes. It is what forces hedges to be unwound as the close approaches, and it is why afternoons have a character of their own: the heavier the 0DTE weight, the harder it pulls. The Charm Wall marks where it weighs most.
As context, not as a signal. If charm is strong and 0DTE dominates, the afternoon tends to stick to the levels. If volatility has been falling with high vanna, the floor holds better than it looks. Neither tells you where to enter: they tell you what kind of day it is.
08 · The terminalHeatmap: gamma by strike and by hour
The strike profile shows you the snapshot of now. The heatmap shows you the film: each column is a moment of the session, each row a strike, and the color, how much gamma sat there at that instant.
What you see at a glance is whether the structure held or moved. A band of color that stays at the same height all session is a real wall. One that drifts along with price is positioning being built on the fly — typical of 0DTE — and it holds far less.
Below it run the day's vanna and charm curves, total and 0DTE only, so you can see what hour each one bites. You can pick any stored session from the day dropdown.
09 · The terminalHow much past you have available
| What | How much is kept |
|---|---|
| Intraday snapshots spot, Zero Gamma, walls, expected move, regime | One roughly every 5 minutes during the session (sparser outside hours), 90 days. |
| Per-contract chain | One snapshot every 15 min, 30 days, on SPX · NDX · SPY · QQQ. |
| Daily closes with levels | Permanent archive, one more session every day. |
| Price candles | 1-minute for intraday and up to five years of daily candles. |
The 90 days of intraday and the 30 of the chain are the ceiling, not what exists today: they fill from the day they were switched on. The past cannot be re-bought — either it was stored at the time, or it does not exist. Which is why the platform has more memory every week than it had the week before.
10 · InstallationTradingView
The indicator is already in your TradingView account: when you signed up we granted you access, and it shows up in your indicator list. You do not have to copy any code, open the Pine editor or paste anything: the day's levels are already inside the indicator. You just add it to the chart once and it updates on its own every morning.
-
Open the chart
Go to TradingView and open the symbol you are going to trade, for example
NQ1!orES1!. -
Save your TradingView username in your dashboard
Access to the indicator is tied to your TradingView account, not to your email. In your GexVision dashboard, scroll to the TradingView card → Indicator access, type your username and press Save. You get a confirmation email right away; when we activate it you get another email (up to 24 h, usually much less) and that card shows access active ✓. If more than 24 h go by, write to [email protected].
What is your username? In TradingView click your avatar (top-right corner): it is the name in
tradingview.com/u/your-username. You can also paste your full profile link into the field — we parse it either way.It is not the email you signed up with here, nor the display name on your profile. It is the username in the address.
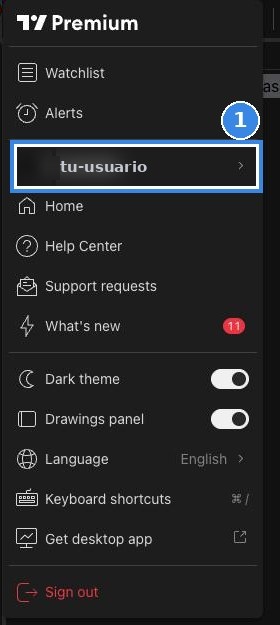
① This name — the one shown when you click your avatar — is your TradingView username. That is the one you save in your GexVision dashboard. -
Add the indicator
Once your access is active: open the chart, click Indicators in the top bar and in the left-hand list you will see a new section called Invite-only. Open it, click
GexVision - GEX Levelsand it is added to the chart.
① The Indicators button, in the bar above the chart. 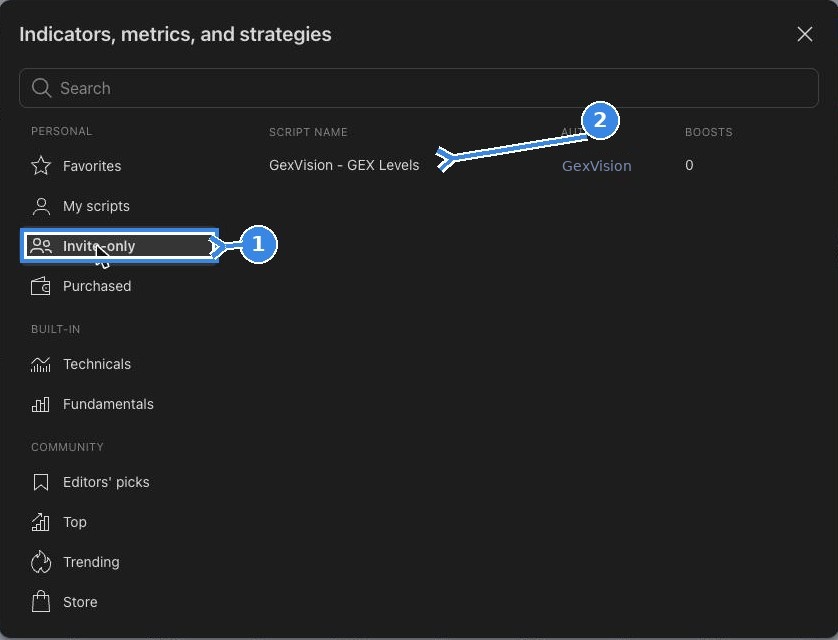
① The Invite-only section in the sidebar: it appears once your access is active. ② Click GexVision - GEX Levels and it is added to the chart. Note: the search box only looks through public community scripts — always use the sidebar. Can't see the "Invite-only" section?That is normal, and it is almost always one of these three things:
1. Your access is not activated yet. The section only exists once you have at least one invite-only indicator granted — before that, TradingView does not even show it. Check the status in your GexVision dashboard: if it says pending activation, wait for the email.
2. You are using the search box. Typing "GexVision" in the Indicators search looks through public community scripts; ours is not there. Use the left-hand list of the Indicators panel instead: Favorites, My scripts, Invite-only…
3. The saved username is not yours (or has a typo). Compare it letter by letter with the one in
tradingview.com/u/…and fix it in your dashboard — fixing it restarts the activation. -
Done — the levels appear on their own
As soon as you add it, the day's levels draw on the price, with their labels and the summary panel in the corner. You don't have to paste anything: the levels are already inside the indicator.
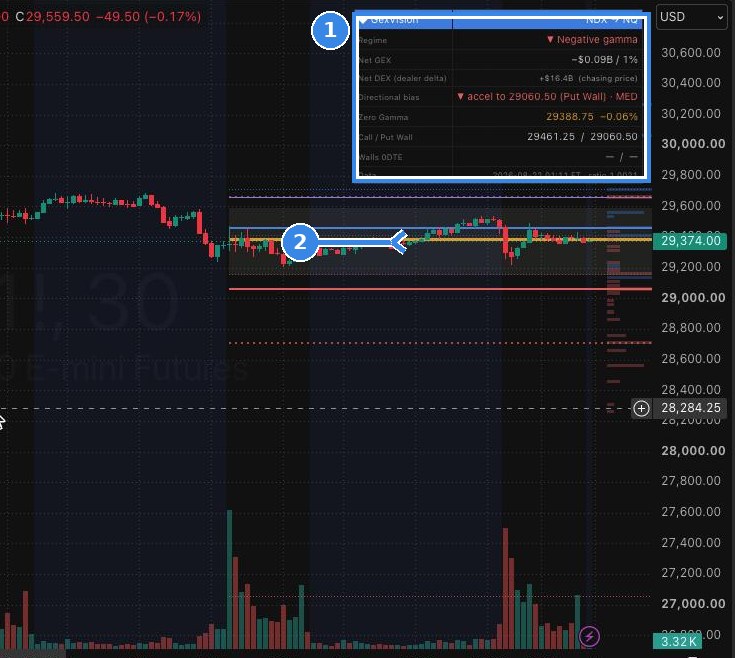
The indicator running on an NQ chart. ① The summary panel: regime, Net GEX, Net DEX, directional bias, Zero Gamma, walls and the data timestamp — note NDX → NQ: levels come from the index and convert automatically to the futures price. ② The levels drawn on price: Zero Gamma in yellow, Call Wall in blue, Put Wall in red, with the per-strike gamma profile on the right. The indicator has a Data field in its settings for advanced use (pasting levels by hand); in normal use you leave it empty and never need it.
-
Save the layout (optional, but handy)
Save the chart or create a template with the indicator already on it. That way it's set up for good — and since the levels update on their own, you never have to touch anything again.
Automatic conversion to futures
The levels are computed on the index or the ETF (SPX, NDX, QQQ, SPY, IWM, DIA...). When the chart is a futures chart —ES, NQ, RTY, YM and their micros— the indicator automatically converts each level to the futures price using the live ratio between the two:
futures_level = strike x (futures_price / index_price)The ratio recalculates on its own while both instruments are quoting at the same time, and freezes at the last valid value outside those hours.
The toggle is called Convert levels to the chart symbol and it is on by default. If at some point the ratio cannot be computed, or you want to fix it yourself, use Manual ratio (0 = automatic): type the value and the indicator will use it instead of the automatic one. For example, NQ/NDX runs around 1.002 and NQ/QQQ around 41.2.
On their own. Each morning we publish the day's levels inside the indicator and your chart picks them up automatically. TradingView may show a small update available notice on the indicator — accept it (or reload the chart) and you have the day's levels. You paste nothing.
Open interest — where the walls and Zero Gamma come from — is published by the market once a day, so the morning update gives you the full set of levels. Price and the volume-based walls keep recalculating during the session.
The settings also control what gets drawn: Zero Gamma and its 0DTE variants, all-expirations and 0DTE walls, weekly and monthly walls, Max Gamma, gamma support/resistance, OI walls, expected move, the GEX profile by strike, how many GEX levels to show (from 1 to 10) and whether you want the Hold/Break labels. You can also change colors, line thickness, label size and the position of the summary panel.
11 · InstallBookmap
The Bookmap add-on connects on its own: it asks the GexVision server for your levels every 60 seconds using your access key, and draws them on the heatmap already converted to the futures price you have open. There are two versions: the native add-on (.jar), which is the recommended one, and the Python version (.py). This guide was made on Bookmap 7.6 (the screenshots are real); 7.4 and 7.5 use the same menu names.
Read this first. Bookmap sets conditions that are outside our control:
- It is not your Bookmap package. Bookmap Support told us directly: by default, BookmapData does not allow custom add-ons to run with real-time non-crypto data, regardless of the user's license. Upgrading your package will not change this, so please don't buy anything expecting it to. It is a compliance rule with the data provider, not a feature gate. This applies to both the .jar and the .py — the native one does not get around the rule.
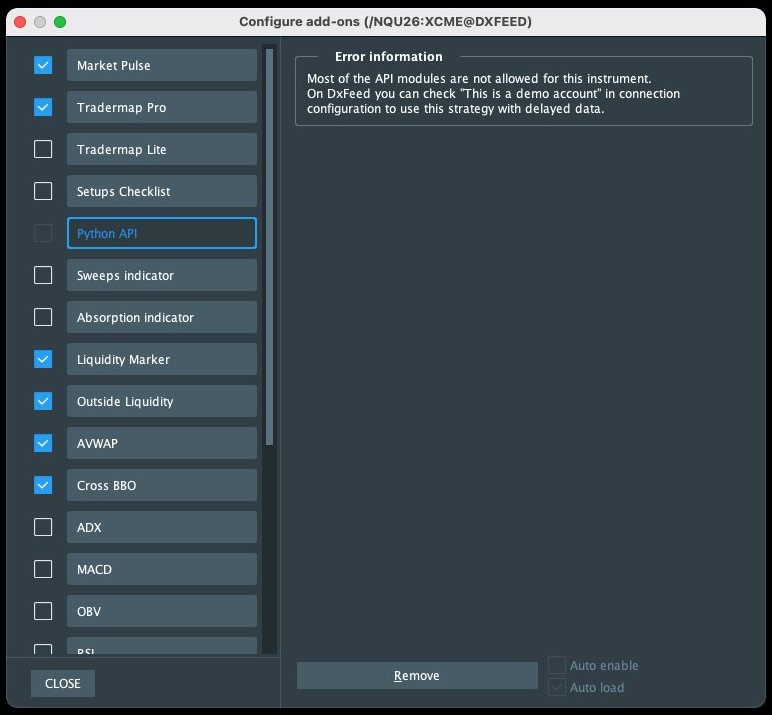
- What it depends on is the connection. On a delayed data connection there are no restrictions and the add-on works today. On real-time BookmapData it is blocked until Bookmap authorises our add-on on their side (a process we have open with them now); on real-time dxFeed that approval comes from dxFeed rather than Bookmap, and is a separate process. While it is blocked the checkbox comes up greyed out, with the notice “Most of the API modules are not allowed for this instrument”.
There is a path that does work without changing package, and we checked it on a real Bookmap 7.6 install: on a connection carrying delayed data the add-on starts and draws. Step by step in “If the checkbox is greyed out”, at the end of this section. The web dashboard and the TradingView indicator don't depend on any of this.
Option A · Native add-on (.jar) — recommended
One file, no Python, nothing to install.
-
Download YOUR .jar from the dashboard
In your GexVision dashboard, TradingView card → Bookmap block → Download native add-on (.jar). The file gexvision-bookmap.jar already contains your access key and the server address. Keep it in a fixed folder (for example Documents/GexVision). It's personal: don't share it.
-
Add it in Bookmap
Text menu bar at the top of the window (not the gear icon): Settings → Configure add-ons. Add… sits below the add-on list, in the left column. (Where that menu is: screenshots ① and ③ under option B below.)
If you can't see the “Add…” buttonIt's not missing: the Configure add-ons window opens shorter than its own content, so the button is cut off below the list. Drag the window's bottom edge down (or move it to a taller screen) and Add… and Manage add-ons appear. This is the single most common reason people can't find where to add it.
Click Add…, pick gexvision-bookmap.jar and, when GexVision levels shows up in the list, tick its checkbox.
-
Open your chart
NQ, ES, MNQ, MES, RTY, YM, or SPX/NDX/SPY/QQQ/IWM/DIA. Within a minute you get Zero Gamma (amber), Call Wall (blue), Put Wall (red), Max Gamma (violet), gamma support/resistance (dashed) and the GEX 1-5 ladder (dotted), converted to the futures price. They refresh every 60 seconds.
Add-on settings (key, server, refresh seconds, how many GEX lines, line width): in Configure add-ons, select GexVision levels; the panel on the right also shows the connection status (“OK · NDX via NQ”, or the error). If you regenerate your access key, download the .jar again or paste the new key there.
Option B · Python version (.py)
Only if you prefer Python or want to edit the script.
Requirements (option B)
- Bookmap 7.4 or newer (guide made on 7.6).
- Python 3.7 or newer on the same machine (python.org/downloads; on Windows tick “Add Python to PATH” when installing).
- Bookmap's Python library, once, from a terminal (Mac: Terminal; Windows: Command Prompt):
pip3 install --user bookmapCheck it worked with python3 -c "import bookmap; print('ok')" (on Windows, python instead of python3). If it prints ok, carry on.
Installing the Python version, step by step
-
Download YOUR file from the dashboard
In your GexVision dashboard, TradingView card → Bookmap block → Download my Bookmap add-on. The file gexvision_bookmap.py already contains your access key and the server address: nothing to configure. Keep it in a fixed folder (for example Documents/GexVision).
It's personal: don't share it. If you regenerate your access key, download it again.
-
Find the right menu in Bookmap
Bookmap has two “Settings”. The gear icon opens the general settings — it's not there. What you want is the text menu bar at the top of the window (File · Connections · Settings · Help). On a Mac that menu is inside the Bookmap window, not in the system menu bar.
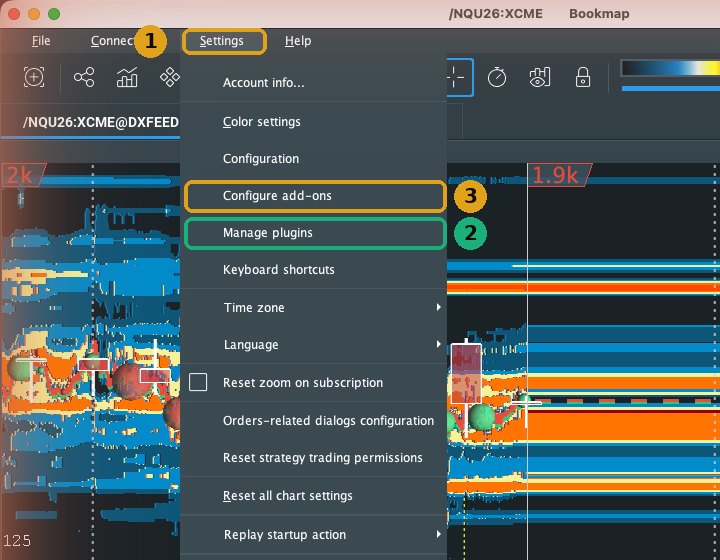
① The Settings menu in the top bar. ② Manage plugins: installs the Python API (step 3). ③ Configure add-ons: enable and configure the add-on (step 4). Before 7.4 this dialog was called “Api plugins configuration”. -
Install Bookmap's “Python API” (once)
Settings → Manage plugins → Bookmap Add-ons (L1) tab → find Python API in the list and click Install. If it already shows a Remove button, you have it. Close with OK.
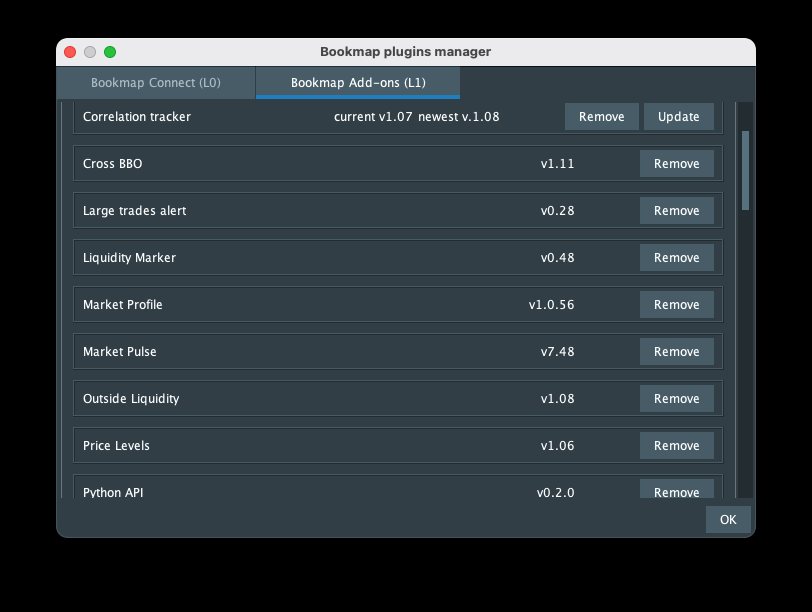
The plugins manager with Python API installed (v0.2.0). It's a free Bookmap add-on. -
Enable the Python API and add your file
Settings → Configure add-ons. In the list on the left find Python API and tick its checkbox. In its panel:
- Click Set custom runtime and pick the Python executable where you installed
bookmap(on a Mac usually /usr/bin/python3 or /opt/homebrew/bin/python3; on Windows C:\Users\you\AppData\Local\Programs\Python\Python3xx\python.exe). - Open the embedded editor (Open embedded editor), add your gexvision_bookmap.py to the script list (or paste its contents into a new script with that name) and click Save then Build.
- Back in Configure add-ons, the script shows up as one more add-on: tick its checkbox to enable it.
These three points follow Bookmap's official Python API guide. If your Python API panel shows the “not allowed for this instrument” notice instead, jump to “If you don't see the levels”.
- Click Set custom runtime and pick the Python executable where you installed
-
Open your chart
Open the instrument — NQ, ES, MNQ, MES, RTY, YM, or SPX/NDX/SPY/QQQ/IWM/DIA — and within a minute Zero Gamma, Call Wall, Put Wall, Max Gamma and the GEX 1-N ladder appear on the heatmap, converted to the futures price. They refresh every 60 seconds.
What you'll see on the chart, and how often it refreshes
Once the checkbox is ticked the add-on works on its own: nothing to press, nothing to reload. It asks our server for your levels every 60 seconds and redraws them on the heatmap, already converted to the price of the futures contract you have open.
These are all the lines it draws. The colours are the same ones you see in the dashboard and on TradingView, so a level reads the same everywhere:
| Line in Bookmap | Style | What it is |
|---|---|---|
| GexVision Zero Gamma | amber, solid | The flip: above it dealers dampen the move, below it they amplify it. Read more |
| GexVision Call Wall | blue, solid | Ceiling and magnet at once, where rallies tend to stall. Read more |
| GexVision Put Wall | red, solid | The floor: where the biggest put gamma sits. Read more |
| GexVision Max Gamma | violet, solid | The strongest magnet on the chart, the pin. Read more |
| GexVision Gamma Res | blue, dashed | The first relevant strike with positive gamma above spot — the nearest resistance, closer in than the Call Wall. |
| GexVision Gamma Sup | red, dashed | The first relevant strike with negative gamma below spot — the nearest support, closer in than the Put Wall. |
| GexVision GEX 1 … GEX 10 | blue, dotted | The gamma ladder: the strikes with most gamma, ranked. Five are drawn by default. Read more |
If the levels don't move, nothing is broken. The add-on checks every 60 seconds, but the data underneath doesn't change that fast: open interest is published once a day by the clearinghouse and reflects the previous close, and the free CBOE feed runs about 15 minutes behind. These are structural positioning levels, not ticks — it is perfectly normal to watch for ten minutes and see Zero Gamma exactly where it was.
What does shift during the session is the conversion to the futures price: the levels arrive already converted, so as the index-to-futures basis moves, the drawn line follows it.
The add-on's settings panel
In Configure add-ons, with GexVision levels selected, the panel on the right holds:
| Field | What it does |
|---|---|
| Server | Leave empty. Only for pointing the add-on somewhere other than gexvision.io. |
| Access key | Your GexVision key. Leave empty if your file already came with it. |
| Refresh every (s) | How often it asks for the levels. Default 60, range 15 to 600. Lowering it will not make the levels change faster — see the note above. |
| GEX ladder lines (0-10) | How many ladder lines to draw. Default 5; set it to 0 to hide the ladder and keep only the main levels. |
| Line width | 1 to 5, to taste. |
| Status | Your diagnostic. OK · NDX via NQ means it is working; otherwise it shows the exact error. |
Changes take effect with Apply and reload.
Instruments it draws on
The add-on reads the instrument you have open and maps it to its options chain on its own:
| What you open in Bookmap | Chain it uses |
|---|---|
| NQ, MNQ, NAS100, NDX | NDX |
| ES, MES, US500, SPX | SPX |
| RTY, M2K, IWM | IWM |
| YM, MYM, DIA | DIA |
| QQQ, SPY | QQQ, SPY |
The contract month is handled for you: NQU26, MNQZ25 and ESH6 all resolve correctly. On any other instrument the add-on stays quiet and draws nothing.
Advanced configuration (optional)
You don't need any of this: your file comes configured. Only if you want to point it elsewhere or use another key, these two environment variables override what's in the file:
| Variable | What it's for |
|---|---|
| GEXVISION_API_KEY | Your personal access key. It's what authorizes the add-on to read the levels. |
| GEXVISION_SERVER | The GexVision server URL (https://gexvision.io). |
If the add-on's checkbox is greyed out
The notice is always the same: “Most of the API modules are not allowed for this instrument. On DxFeed you can check "This is a demo account" in connection configuration to use this strategy with delayed data.” It is not a fault of the add-on or of your key — it's the Bookmap package, which doesn't allow API add-ons on real-time data. You have two ways out:
-
Free route: a connection with delayed data
We checked this end to end on Bookmap 7.6. Connections → Configure → ADD CONNECTION, platform BookmapData (credentials configure themselves; without the BookmapData CME package it stays on delayed market data, which is exactly what's needed) → OK. Tick that connection in the Connections menu, open a new tab with +, choose that platform and your symbol (NQ, ES…), and in that tab's Configure add-ons the GexVision levels checkbox can now be ticked. In the add-on panel the Status turns to “OK · NDX via NQ” and the levels draw.
The heatmap runs 15 minutes delayed; the GexVision levels do not — they're read live from our server. If you already use dxFeed, the equivalent is to tick “This is a demo account” in that connection's configuration (you have to disconnect it first to be able to edit it).
-
Real-time route: authorisation by Bookmap — in progress
Real-time access is not something you can buy: Bookmap has to authorise our specific add-on file on their side. We have that process open with them, and everyone on a real-time connection gets it at the same time. Upgrading your Bookmap package does not unlock it — their support confirmed the restriction applies regardless of licence.
While you decide, the same levels are available with no conditions at all in the web dashboard, the terminal and on TradingView.
Other reasons for not seeing the levels
- The instrument you opened isn't one of the supported ones. The first read can take up to a minute.
- The add-on's checkbox isn't ticked in Configure add-ons, or the Python runtime isn't the one where you installed
bookmap. pip3 install --user bookmapdidn't finish cleanly, or Python is older than 3.7.- The file isn't the one downloaded from your dashboard, or you regenerated your key after downloading it (the old file kept the old key: download it again).
- The instrument you have open isn't one of the supported ones. The first read can take up to a minute.
Sources: Python API · Bookmap Knowledge Base · BookmapAPI/python-api.
12 · InstallNinjaTrader 8
A NinjaScript indicator that draws the same levels as the dashboard on your chart — Zero Gamma, Call Wall, Put Wall, Max Gamma and the GEX 1-N magnets — and keeps them fresh on its own. It polls the GexVision server with your key every 60 seconds (configurable) and converts the levels to the price of the future you have open: ES/MES → SPX, NQ/MNQ → NDX, RTY/M2K → IWM, YM/MYM → DIA, GC/MGC → GLD. On SPX, NDX, SPY, QQQ, IWM or DIA the levels are used as they are.
What you need. NinjaTrader 8 (any license, the free one works), internet access from that machine and an active subscription. No coding: the file you download already carries your key and the server address.
-
Download YOUR file from the dashboard
In your GexVision dashboard, TradingView card → NinjaTrader 8 · Sierra Chart block → NinjaTrader 8 (.cs). You get GexVisionLevels.cs with your access key already inside. It's personal: don't share it. If you regenerate your key, download it again.
-
Copy the file into NinjaTrader's indicators folder
Open Documents\NinjaTrader 8\bin\Custom\Indicators (Windows: This PC → Documents → NinjaTrader 8 → bin → Custom → Indicators) and paste GexVisionLevels.cs there.
Alternative without touching folders: in NinjaTrader, Control Center → New → NinjaScript Editor, right-click Indicators → New Indicator…, name it GexVisionLevels and finish the wizard; open the downloaded .cs in Notepad, copy ALL of it and replace ALL the code the wizard generated.
-
Compile
In NinjaTrader: Control Center → New → NinjaScript Editor. Press F5 (or the compile icon, top right). The bottom bar should say “Compiled successfully”. Once is enough; if you update the file, compile again.
-
Add it to your chart
Open a chart of NQ, ES, MNQ, MES, RTY, M2K, YM, MYM, GC, MGC, or the index/ETF itself. Right-click the chart → Indicators… (or Ctrl+I) → find GexVision Levels → Add → OK.
Within a minute the lines show up with their label and price: Zero Gamma (amber), Call Wall (blue), Put Wall (red), Max Gamma (violet) and the GEX 1-3 magnets (dashed for the first three, dotted after that). Bottom left, a status line: “GexVision · POSITIVE gamma · ratio 1.0007” (the ratio is the futures/index conversion being applied).
Indicator settings
All in the Indicators window when GexVision Levels is selected. You don't need to touch any of them.
| Group · setting | What it does |
|---|---|
| GexVision · Server | https://gexvision.io. Leave it. |
| GexVision · API key (personal) | Your access key. Already filled in the downloaded file; if you regenerate it in your account, paste it here. |
| GexVision · Symbol | Blank = inferred from the chart (NQ → NDX, etc.). Type a symbol (e.g. SPX) only to force another one. |
| GexVision · Refresh every (seconds) | How often it polls the server. 60 by default (minimum 15). |
| GexVision · GEX magnets (0-10) | How many GEX magnets to draw besides the walls. 3 by default. |
| Levels · Show … | Toggle Zero Gamma, Call/Put Wall, Max Gamma, the 0DTE walls and the status text. |
| Colors | Color of each line. |
If you don't see the levels
- “GexVision Levels” is not in the indicator list: the file is not in bin\Custom\Indicators or you didn't compile (F5 in the NinjaScript Editor). If the editor reports errors, the file was copied incompletely: download it again.
- The status says “waiting for data…” and never changes: that machine can't reach gexvision.io (firewall, proxy) or the key isn't yours. Regenerate the key in your account and download the file again.
- “subscription inactive”: the subscription isn't current. Fix it in your account and the lines come back on the next refresh.
- The chart's instrument isn't supported and Symbol is blank: type the symbol by hand.
- Remember the levels change once a day (open interest) and the intraday lines only during options hours: see Data schedule.
13 · InstallSierra Chart
An ACSIL study with the same levels and the same automatic futures conversion as the NinjaTrader one. Sierra Chart can't “install” a study without compiling it, but it does that itself with one button (Build): no Visual Studio, no C++ knowledge needed.
What you need. A recent Sierra Chart (the study uses sc.MakeHTTPPOSTRequest, available since roughly version 2400; if yours is older, update via Help → Download Current Version), internet access and an active subscription.
-
Download YOUR file from the dashboard
In your GexVision dashboard, TradingView card → NinjaTrader 8 · Sierra Chart block → Sierra Chart (.cpp). You get GexVisionLevels.cpp with your key and the server already set. It's personal: don't share it.
-
Copy it into the ACS_Source folder
That's Sierra Chart's custom-studies folder, usually C:\SierraChart\ACS_Source (if Sierra is installed elsewhere, check Global Settings → General Settings → Paths → Data Files Folder and go one level up). Paste GexVisionLevels.cpp there.
-
Build it from Sierra Chart
Menu Analysis → Build Custom Studies DLL. Select GexVisionLevels.cpp in the list and press Build (Remote Build needs no compiler on your PC; the local Build needs the compiler Sierra offers to install from that same window). When it finishes you'll see “Build succeeded” and GexVisionLevels_64.dll appears in the Data folder.
-
Add the study to the chart
Open your chart (NQ, ES, MNQ, MES, RTY, M2K, YM, MYM, GC, MGC, or the index/ETF). Menu Analysis → Studies → Add Custom Study tab → GexVision Levels folder → GexVision Levels study → Add → OK.
On the next refresh (up to a minute) the horizontal lines appear with their label: Zero Gamma, Call Wall, Put Wall, Max Gamma and the GEX magnets. Lines are updated in place (they don't pile up) and refresh every 60 seconds.
Study settings
| Setting | What it does |
|---|---|
| GexVision API key (personal) | Your key. Already in the file; if you regenerate it, paste it here (no rebuild needed). |
| Server | https://gexvision.io. |
| Symbol (blank = auto from chart) | Blank = inferred from the chart. Type SPX, NDX… to force it. |
| Refresh every (seconds) | 60 by default (15–3600). |
| GEX magnets (0-10) | How many GEX magnets besides the walls. 3 by default. |
| Show Zero Gamma / Call·Put Wall / Max Gamma / 0DTE walls | Which lines to draw. |
If you don't see the levels
- Open Window → Message Log: the study writes what's going on there. “paste your API key in the study settings” = the file isn't the one from your dashboard; “request failed (network / server)” = that machine can't reach gexvision.io; “subscription inactive” = the subscription isn't current (your account).
- Build failed: almost always an old Sierra Chart without MakeHTTPPOSTRequest. Update and build again.
- The study isn't listed under Add Custom Study: the DLL wasn't generated (check the Build output) or Sierra can't write to the Data folder.
- Unsupported instrument with Symbol blank: type the symbol by hand.
Both files (NinjaTrader and Sierra Chart) only read the levels with your key; they never send orders or touch your broker account.
14 · DataData schedule
This section explains something that confuses almost everyone during the first week: why the levels do not change every minute, and why after the options close they stop changing altogether. Read it all the way through; it will save you questions.
Open interest is published once a day
Open interest —how many contracts are open at each strike— is published by the OCC once a day, and it reflects the previous session close. There is no such thing as real-time open interest: it is not data the market broadcasts tick by tick.
As a result, the levels built on open interest —the walls, Max Gamma, the GEX 1-10 ladder, Zero Gamma— are stable throughout the session. And that is exactly what you want: they are references for the day, not indicators that flicker.
What does change intraday
Three things move during the session and affect the calculation: the spot price, implied volatility and the time remaining to expiration. With those three inputs GexVision recomputes the gamma of every contract:
| Window | What happens | Frequency |
|---|---|---|
| 08:00 – 17:00 ET | Full recalculation with updated spot, IV and time to expiration. | Every 5 minutes |
| Outside that window | Maintenance refresh, to keep the data ready. | Every hour |
| 16:15 ET | Options close. The values stop changing until the next session. | — |
| Every morning | The new OCC open interest arrives, corresponding to the previous close. | Once a day |
After the options close (16:15 ET) the numbers stay frozen until the next session. If at 18:30 ET you see exactly the same values you saw at 16:20 ET, the system is working correctly: there are no new options quotes to recalculate anything with.
Data delay
The free CBOE data arrives with about a 15-minute delay. For the way it is used here that matters much less than it sounds: the levels are strike prices, not ticks. A strike does not move because price rises two points. What the delay affects is the precision of the spot and the IV used in the recalculation, and that shifts the levels only marginally.
Positioning for the current day
Because open interest is from yesterday, today's positioning changes are approximated with the volume traded during the session. That is where the volume-based 0DTE walls come from: they are an estimate of where positioning is being built in real time, and they are especially useful on days with heavy activity in contracts expiring the same day.
15 · SupportFrequently asked questions
No. GexVision does not generate signals and does not tell you when to enter. It is context and positioning: it shows you where dealer hedging is concentrated and what kind of behavior tends to show up around those prices.
The right way to use it is to combine it with your own process —order flow, structure, your setup— to decide where to look for trades and where not to. The levels inform your decisions; they do not make them for you.
No. The levels do not depend on tick-by-tick data: they are strike prices computed from the options chain. The indicator draws them the same way with delayed data as with real-time data.
The CME data add-on (about 7 USD a month on TradingView) is optional. It gives you the futures price with no delay, which helps if you execute from TradingView, but it does not change where the levels fall or how they are read.
Because open interest is published once a day and reflects the previous close. The walls, Max Gamma and the GEX ladder are built on it, so they are stable throughout the session. That is a feature, not a limitation: a level that moves every minute is useless as a reference.
What does get recalculated every 5 minutes during market hours is the effect of spot, implied volatility and time to expiration. That recalculation mostly shifts Zero Gamma. The full detail is in the Data schedule section.
It works on any symbol with listed options: indexes, ETFs and individual stocks.
One practical caveat: the quality of the read depends on the liquidity of the chain. In SPX, NDX, SPY or QQQ open interest is enormous and the levels are very sharp. On a stock with thin options volume the levels still exist but carry far less weight, because there is little real hedging behind them.
Yes, and it is in fact one of the uses where it shows up most. The indicator computes walls and Zero Gamma only from the contracts expiring today (CW 0DTE, PW 0DTE, ZG 0DTE), which are the ones that dominate intraday behavior in SPX and NDX.
Keep in mind that those levels decay during the session: gamma from the contracts expiring today concentrates closer and closer to price as the close approaches, so the pin effect is much stronger in the afternoon. You also have the volume-based 0DTE walls, which approximate the positioning built during the session itself.
The one you already trade. The levels are horizontal prices: they do not change with the chart timeframe, the same way a support level does not change because you look at it on 5 minutes instead of 15.
In practice, for intraday on NQ or ES they read comfortably on 1- to 15-minute charts. For the context of the day, a look at 30 minutes or the hourly chart helps you see the real distance to each wall. The regime (Zero Gamma, Net GEX) is set once a day and applies to every timeframe.
Email support from the same address you subscribed with and a new key will be generated for you. The old one stops working at that moment, so if you suspect somebody else has it, request the new one as soon as possible.
After that you only have to update it wherever you use it: in the GEXVISION_API_KEY variable of the Bookmap add-on and when you sign in to the GexVision dashboard. The TradingView indicator does not store the key, so there is nothing to change there.
Yes. The license is personal, not per device: you can have it on your home computer, your office computer and your laptop, as long as it is for your own use.
The TradingView indicator is tied to your TradingView account, so it is available from any browser you sign in to. For Bookmap, install the add-on on each machine and define the GEXVISION_API_KEY and GEXVISION_SERVER variables on each one. What is not allowed is sharing your key with other people.
Because it is converted, and that is how it should be. The levels are computed on the index (NDX, SPX...) and the future trades at a different price because of cost of carry and dividends. The indicator applies the live ratio between the future and the index to place each level at the equivalent futures price.
If the ratio cannot be computed —for example, outside the hours when both are quoting— the last valid value is used. You can fix it yourself with Manual ratio in the settings.
It happens, and it will happen. The Hold/Break labels with HIGH, MED or LOW intensity describe positioning tendencies, not certainties. A macro print, a headline or a large institutional flow can go through any level.
What is useful is what happens afterward: when a Hold HIGH level gives way with acceptance, that break is usually informative, because it means enough flow came in to overwhelm dealer hedging. Always manage risk assuming that any level can fail.
Legal disclaimer
GexVision is an educational and analytical tool. The information, levels and readings it provides are supplied for informational purposes only and do not constitute financial, investment, legal or tax advice, nor a personalized recommendation to buy or sell any instrument.
Trading futures, options and other leveraged products carries a substantial risk of loss and is not suitable for all investors. You can lose all of your capital. Trade only with money you can afford to lose.
Past results do not guarantee future results. No level, label or reading in this tool implies a guaranteed probability of being right. The levels are derived from third-party options data that may arrive delayed, be incomplete or contain errors.
All trading decisions and their consequences are the sole responsibility of the user.